Debug Jest with VSCode

Jest has become the goto testing framework in the frontend space, whether it is for React or for Angular. In Nx it is even the default choice when generating a new Angular app. Debugging can be a bit more cumbersome though, in contrast to Karma. Let’s see.
Jest is quite established in the React community. In contrast, the Angular community is mostly leaning towards the Karma + Jasmine setup when it comes to the unit test runner. That’s mostly because that’s what is generated when creating a new project with the Angular CLI. But Jest is definitely not limited to React. In fact a lot of Angular devs start to pick it up, to the point where we at Nrwl (yes I joined a couple of months ago) we decided to use it as the default when generating a new project in Nx (regardless of Angular or React).
Debugging unit tests using Karma
Debugging unit tests written with Karma is quite straightforward. Make sure you use some Browser as the runner (i.e. Chrome). Start the test in watch mode and then click the “Debug” button on the upper right corner. That’ll open up the test run in debug mode which will allow you to open your browser devtools and debug just as you’d normally do with your webapp.
I mentioned this previously when troubleshooting some weird error in a Karma & Jasmine based test
Debugging with VSCode
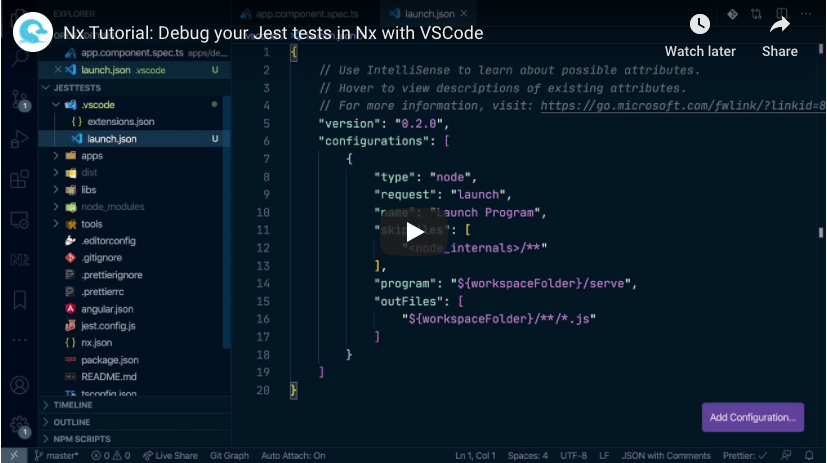
With Jest it is a bit different. Jest uses JSDom underneath, so there is no real browser running. Jest uses Node. However, you can create a handy VSCode launch configuration to allow you to debug your tests from within your IDE.
Here’s a short video I recorded to walk you through.
(Also, console.log works surprisingly well many times 😉)
Note, this also works with a plain normal Angular CLI project :smiley:.
VSCode launch configuration
Here’s the snippet for easy copy & paste
{
  "version": "0.2.0",
  "configurations": [
    {
      "type": "node",
      "request": "launch",
      "name": "Jest Current File",
      "program": "${workspaceFolder}/node_modules/@angular/cli/bin/ng",
      "cwd": "${workspaceFolder}",
      "args": [
        "test",
        "--testPathPattern=${fileBasenameNoExtension}",
        "--runInBand"
      ],
      "console": "internalConsole",
      "internalConsoleOptions": "neverOpen",
      "disableOptimisticBPs": true
    },
    {
      "type": "node",
      "request": "launch",
      "name": "Jest Current File (using nx)",
      "program": "${workspaceFolder}/node_modules/@nrwl/cli/bin/nx.js",
      "cwd": "${workspaceFolder}",
      "args": [
        "test",
        "--testPathPattern=${fileBasenameNoExtension}",
        "--runInBand"
      ],
      "console": "internalConsole",
      "internalConsoleOptions": "neverOpen",
      "disableOptimisticBPs": true
    }
  ]
}