Entity Framework: Intercepting SQL Queries for Contextual Logging

While I’d like to go a bit deeper into the concept of properly log and aggregate information, this post is just meant to evidence a specific case I just had of properly including contextual information into log entries. Specifically, a work mate of mine recently had a strange problem of getting an “Insufficient Priviledges” exception in his production environment. It appeared from now and then and was not really reproducable. Being related to some query execution, in that case it would be of major help to know which kind of query was executed by Entity Framework (in our case) against the underlying Oracle database that finally resulted in the mentioned exception.
The immediate approach that came to my mind is to somehow hook in a profiler in between Entity Framework and the DB, to trace and memorize all executed SQL Queries for then - later - being able to take them out in case an exception was fired. That would make it particularly easy to include the SQL statement in the log message as a contextual information for those kind of exceptions.
MiniProfiler to the Help
I did a quick googling about intercepting Entity Framework statements against the DB, found some stuff but they seemed rather complicated to setup as it required to wrap the EntityContext class etc.
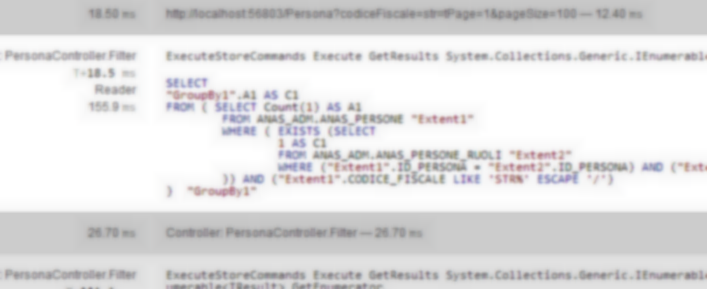
That was when MiniProfiler came to my mind. We’re using to for live-profiling our application while developing it (have to blog about how I set that up for single-page JS apps). The nice nice thing about MiniProfiler is that it also traces SQL queries, their according execution time, whether you have duplicate queries and it even shows you a formatted SQL statement. That was exactly what I needed and so I started to take a look at the MiniProfiler’s source for being able to understand where I could hook in.
Installing and Registering MiniProfiler
Installation of MniProfiler is quite straightforward. Just head over to NuGet and install the packages you need.
Remember to properly initialize it for tracing Entity Framework queries (if that’s what you’re using)
    MiniProfiler.Settings.SqlFormatter =
        new StackExchange.Profiling.SqlFormatters.InlineFormatter();
    MiniProfilerEF.Initialize();
This is important, as otherwise you won’t get the params printed in your SQL statement. Then to call MiniProfiler.Start() and MiniProfiler.Stop() in the begin and end request events respectively. Note that such setup should already be included in the MVC3 NuGet package and just needs to be customized.
Querying MiniProfiler’s Logs
MiniProfiler has a very intelligently designed structure. Everything starts from invoking MiniProfiler.Current
var profiling = MiniProfiler.Current;
if(profiling != null)
{
}
which returns the currently running profiler (or null if none) for the current HttpContext. What I was particularly interested in is to understand which of the profilings did actually contain SQL related stuff. This can be retrieved by using the according HasSqlTimings property
var profiling = MiniProfiler.Current;
if(profiling != null && profiling.HasSqlTimings)
{
}
Then invoking the according GetSqlTimings() method, returns a list of SqlTiming objects containing - beside other timing specific information - all “timings” that involved an execution of an SQL statement.
var profiling = MiniProfiler.Current;
if(profiling != null && profiling.HasSqlTimings)
{
    var timings = profiling.GetSqlTimings();
}
Finally, FormattedCommandString returns a formatted version of the executed SQL statement which you should be able to directly executable against your DB.
So I endend up having some very simple piece of code that looked similar to this:
private string CollectExecutedQueries()
{
    var stringbuilder = new StringBuilder();

    var profiling = MiniProfiler.Current;
    if (profiling != null && profiling.HasSqlTimings)
    {
        var timings = profiling.GetSqlTimings();

        foreach (var timing in timings)
        {
            stringbuilder.AppendLine(Environment.NewLine + "----START QUERY----");
            stringbuilder.AppendLine(timing.FormattedCommandString);
            stringbuilder.AppendLine("----END QUERY----");
        }
    }

    if (stringbuilder.Length > 0)
    {
        return Environment.NewLine + Environment.NewLine + "EXECUTED QUERIES: " + Environment.NewLine + stringbuilder.ToString();
    }

    else return "";
}
Please don’t take this code as is. I’m just about revising this further and publishing it in production. That will reveal whether it really was that simple or whether it needs to be improved. But first tests are promising and it seems to work properly.
Conclusion
What’s impressive is the ease with which MiniProfiler allows you to intercept SQL commands sent to the DB and the immense insight you get. Reading out the executed SQL command is really just a very simple use case of what MiniProfiler offers. I could imagine scenarios of sending automated warn logs when having duplicate or slow queries in your production environment.